
Cashback loot table: actual gold ranked
For a debt-free cardholder spending $1,480 monthly in eligible categories, flat 2% cashback produced the most dependable gold: $296 net per year after a $59 excluded-cash adjustment. Rotating 5% categories reached $220, retailer offers $119, free round-up bonuses $63, and a paid reward booster only $36 after its fee.
This is a ranking of features, not financial institutions. No invented products are hiding in the table. I modeled common reward structures against one fixed 2026 spending profile so the result measures mechanics rather than a signup bonus that disappears.
The test profile and rules
The profile spends $1,480 a month on a card and pays the statement balance in full. Eligible annual spend is $14,800 after excluding rent, transfers, cash-equivalent purchases and merchants that commonly reject rewards. Groceries are $420 monthly, fuel and transit $180, dining $220, online retail $260 and other eligible purchases $400.
Any interest charge would destroy the ranking. At a hypothetical 24% APR, carrying even $1,000 for two months costs about $40—more than a month of 2% rewards on the entire profile. If a card balance revolves, the best loot mechanic is usually paying it down. Our APR and compound-interest entries explain why.
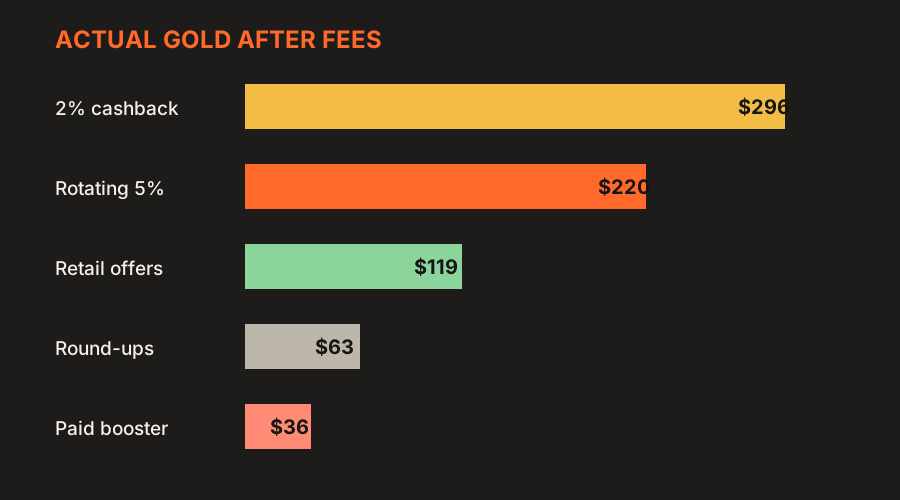
The 2026 loot table
| Rank | Feature | Gross | Costs / leakage | Net gold |
|---|---|---|---|---|
| 1 | Flat 2% cashback | $296 | $0 fee | $296 |
| 2 | Rotating 5% categories | $246 | $26 missed activation/caps | $220 |
| 3 | Retailer-linked offers | $151 | $32 impulse leakage | $119 |
| 4 | Free matched round-ups | $63 | $0 fee | $63 |
| 5 | Paid reward booster | $96 | $60 membership | $36 |
1. Flat 2%: common loot, excellent reliability
Two percent of $14,800 is $296. There were no category activations, redemption gymnastics or annual fee in the model. I assumed cash could be redeemed as a statement credit at full value. That lack of drama is a feature: the user can choose merchants by price and quality instead of hunting a special portal.
2. Rotating 5%: rare loot with inventory work
The model applies 5% to $4,200 of quarterly-category spend and 1% to the remaining $10,600, producing $316 gross in pure arithmetic. I then reduced the result for one late activation, a quarterly cap, and $70 of category spend that coded differently. Against a comparable 1% baseline, the incremental reward produced the $220 figure shown.
A meticulous player might beat $220. A distracted player can land below the flat card. Calendar reminders on January 1, April 1, July 1 and October 1 help, but time has value even when no fee appears.
3. Retailer offers: strong only after the shopping list
Card-linked offers returned $151 in the modeled year. I deducted $32 because two purchases exceeded the prewritten shopping list to trigger a deal. That leakage is conservative; “spend $80, get $10” can easily create $25 of unwanted spend. The safe order is list, merchant comparison, then offer—not offer, then invented need.
4. Round-ups: saving wearing a reward helmet
The account rounded 210 monthly transactions by an average $0.50, moving about $1,260 a year. That looks like a rich haul, but $1,197 came from the user’s checking account. Only a 5% match on eligible round-ups—$63—was external reward. Round-ups can be a useful automation tool; they should not be described as $1,260 earned.
5. Paid boosters: subtract admission
A membership added $8 a month in incremental rewards, or $96 annually, but cost $5 a month. Net value was $36. One month of overspending would erase it. Paid tiers deserve the same annual-price inspection we apply in our budgeting-app ranking.
How to choose your own drop
Export 90 days of transactions, remove ineligible spend, and multiply the remainder by the actual rate. Subtract annual fees, portal markups and purchases you would not have made. Then divide net reward by hours spent activating, tracking and redeeming. The best feature is the one that survives that subtraction while the balance is paid in full.
For this profile, flat cashback wins because its $296 is both large and difficult to sabotage. A grocery-heavy household could prefer a capped category card. A cash user may value merchant offers less than privacy and simplicity. The table is a method, not a universal chest.
At half the annual spend, flat 2% fell cleanly to $148, while the paid booster’s $60 fee stayed fixed and pushed its modeled net below zero. Judge a reward tier against conservative spend, not a best-case calculator. Fees are certain; category fit and perfect redemption are not.
Frequently asked questions
Do round-ups count as cashback?
Usually not. The rounded amount generally comes from your own checking account. Count only a bank or card match, bonus or interest as reward; count the transfer itself as savings.
Is 5% cashback always better than 2%?
Only on eligible spend within caps and after activation. Compare the blended annual rate across all purchases, not the largest number in the advertisement.
Should I pay a fee for better rewards?
Pay only when conservative incremental rewards and benefits exceed the fee without requiring extra spending. Recalculate before every renewal.